Rithmm Research Feature
GIVING USERS MORE DATAPOINTS PRIOR TO PLACING A BET
Role:
Industry:
Tools:
Sole UX/UI designer
Sports betting tech / sports analytics
Figma, FigJam


View Next Project
TLDR;
The Product
Rithmm is a mobile app giving users the ability to personalize sports betting models.
Users
Beginner bettors who just want trustworthy picks that can make them money, without needing to dig into complex stats.
Advanced, data-driven bettors wanting full transparency into the data and trends behind each pick. Use Rithmm as a secondary data source.
Scroll to Section
The Problem
Rithmm's picks are smart, but without clear data to show the reasoning behind them, many users struggle to fully trust them, limiting long-term engagement.
Goal
Create a research feature that provides just enough context to help beginners trust the picks, while offering full data transparency for advanced users who want to go deeper.
Scroll to Section
Research
Conducted competitive analysis of ESPN, DraftKings, Action, Outlier, Pikkit, and Linemate to understand common patterns for surfacing sports data.
Met with the CTO, PM, and engineers to define exactly what data Rithmm could leverage.
Explored different entry points (homepage vs bottom navigation), ultimately choosing the bottom navigation bar for always-on access.
Scroll to Section
Proposed Solutions
Grouped and categorized available data to reduce cognitive overload.
Created wireframes and lo-fi screens exploring layout, hierarchy, and visual treatments.
Designed the research feature to work both as a standalone tool and a companion to each pick, allowing users to switch between picks and research seamlessly.
Scroll to Section
Internal Review & Revisions
Gathered feedback from the internal team.
Based on feedback, refined the information hierarchy, clarified visual treatments, and reinforced the decision to prioritize bottom nav placement for frictionless access.
Scroll to Section
Final Design
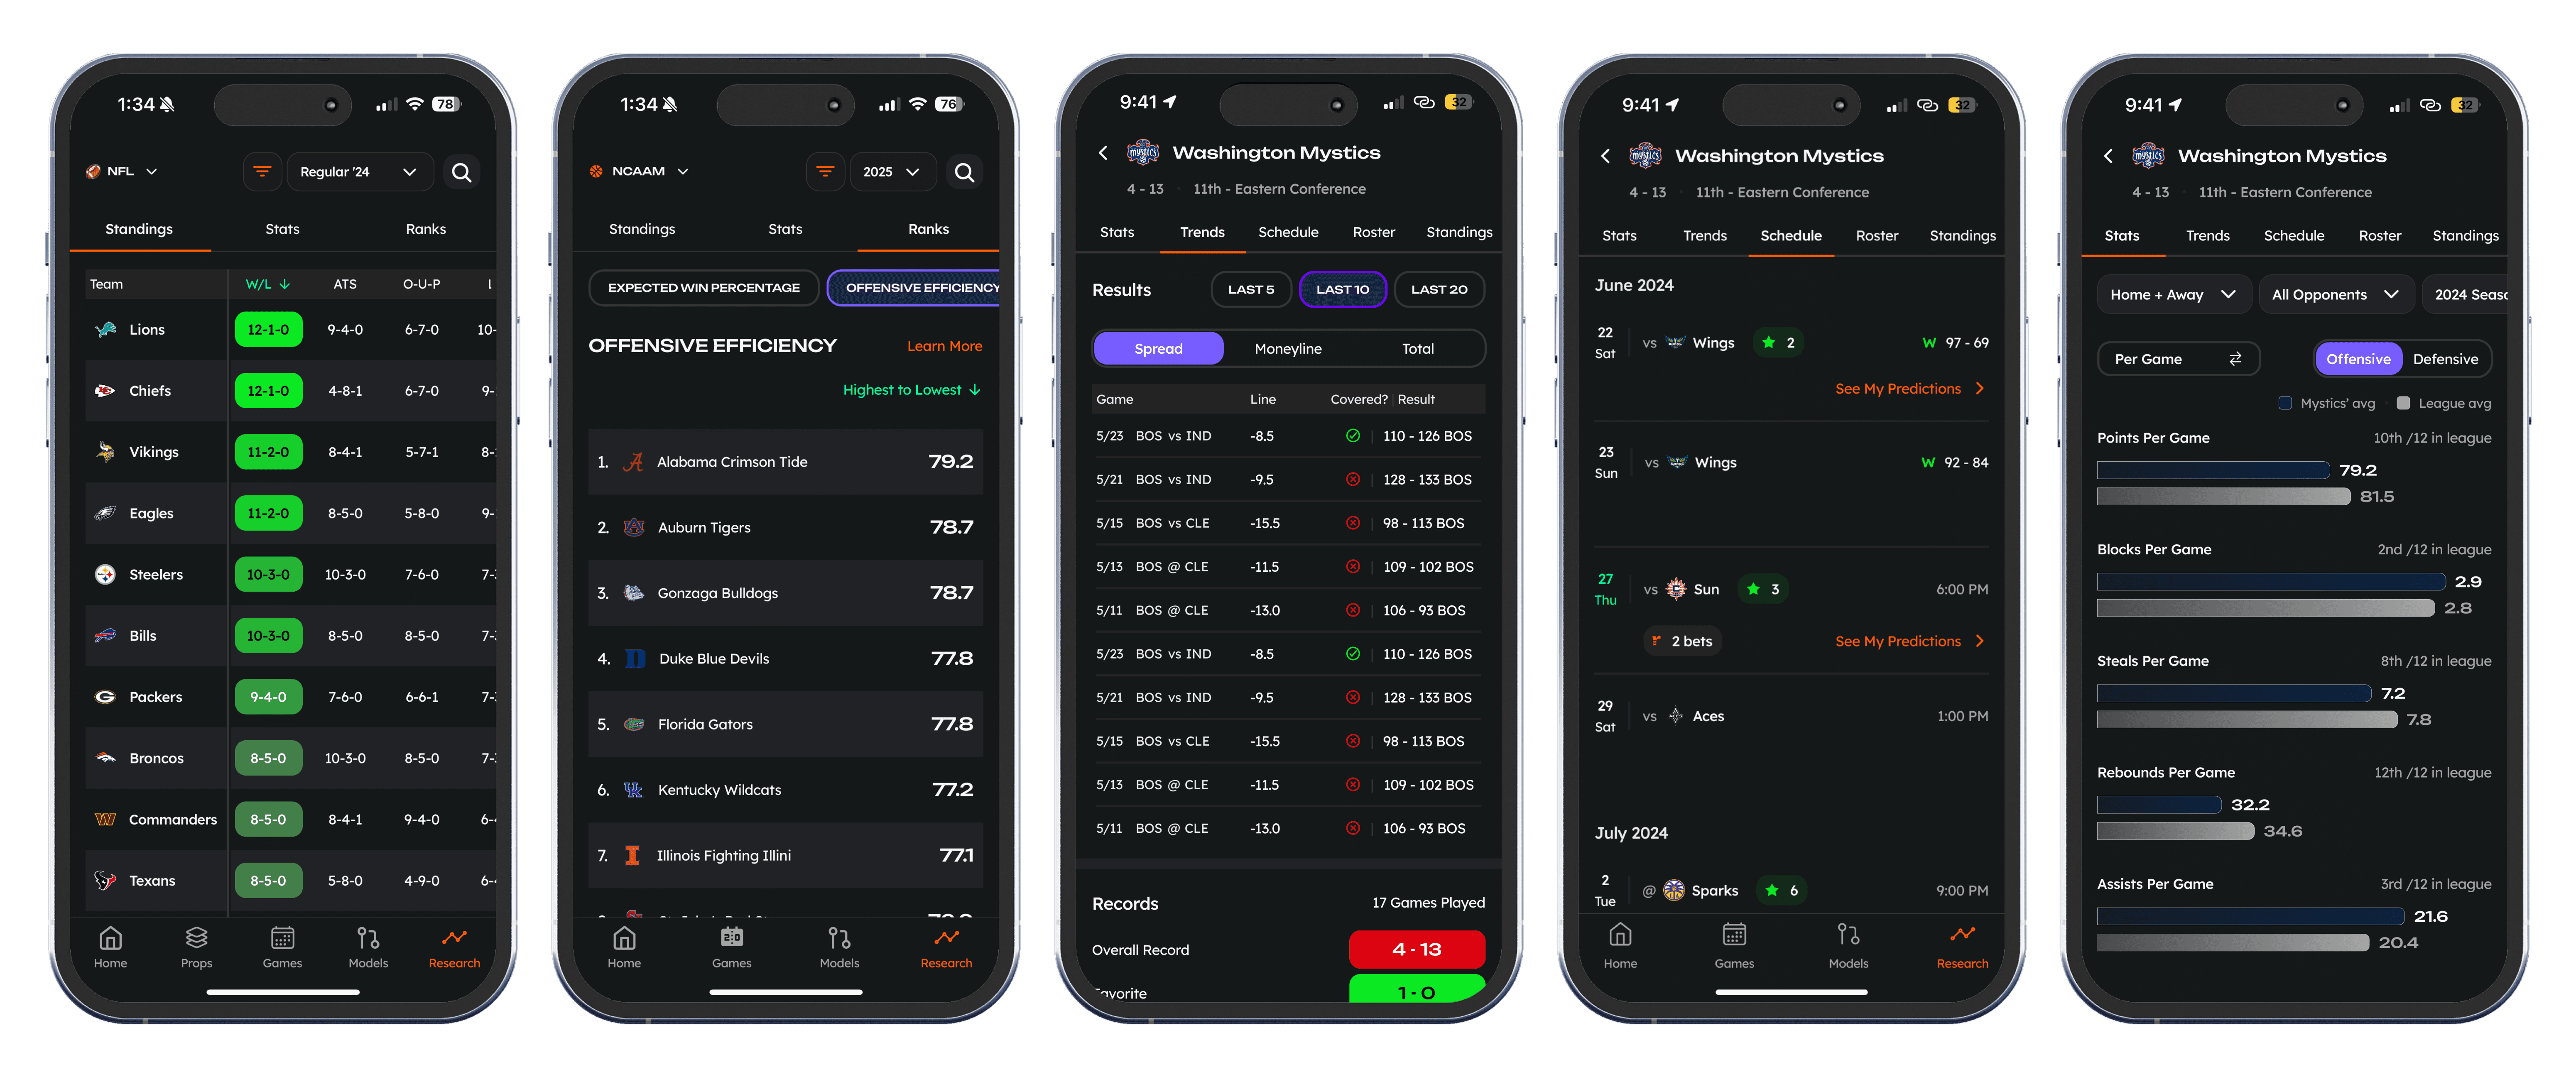
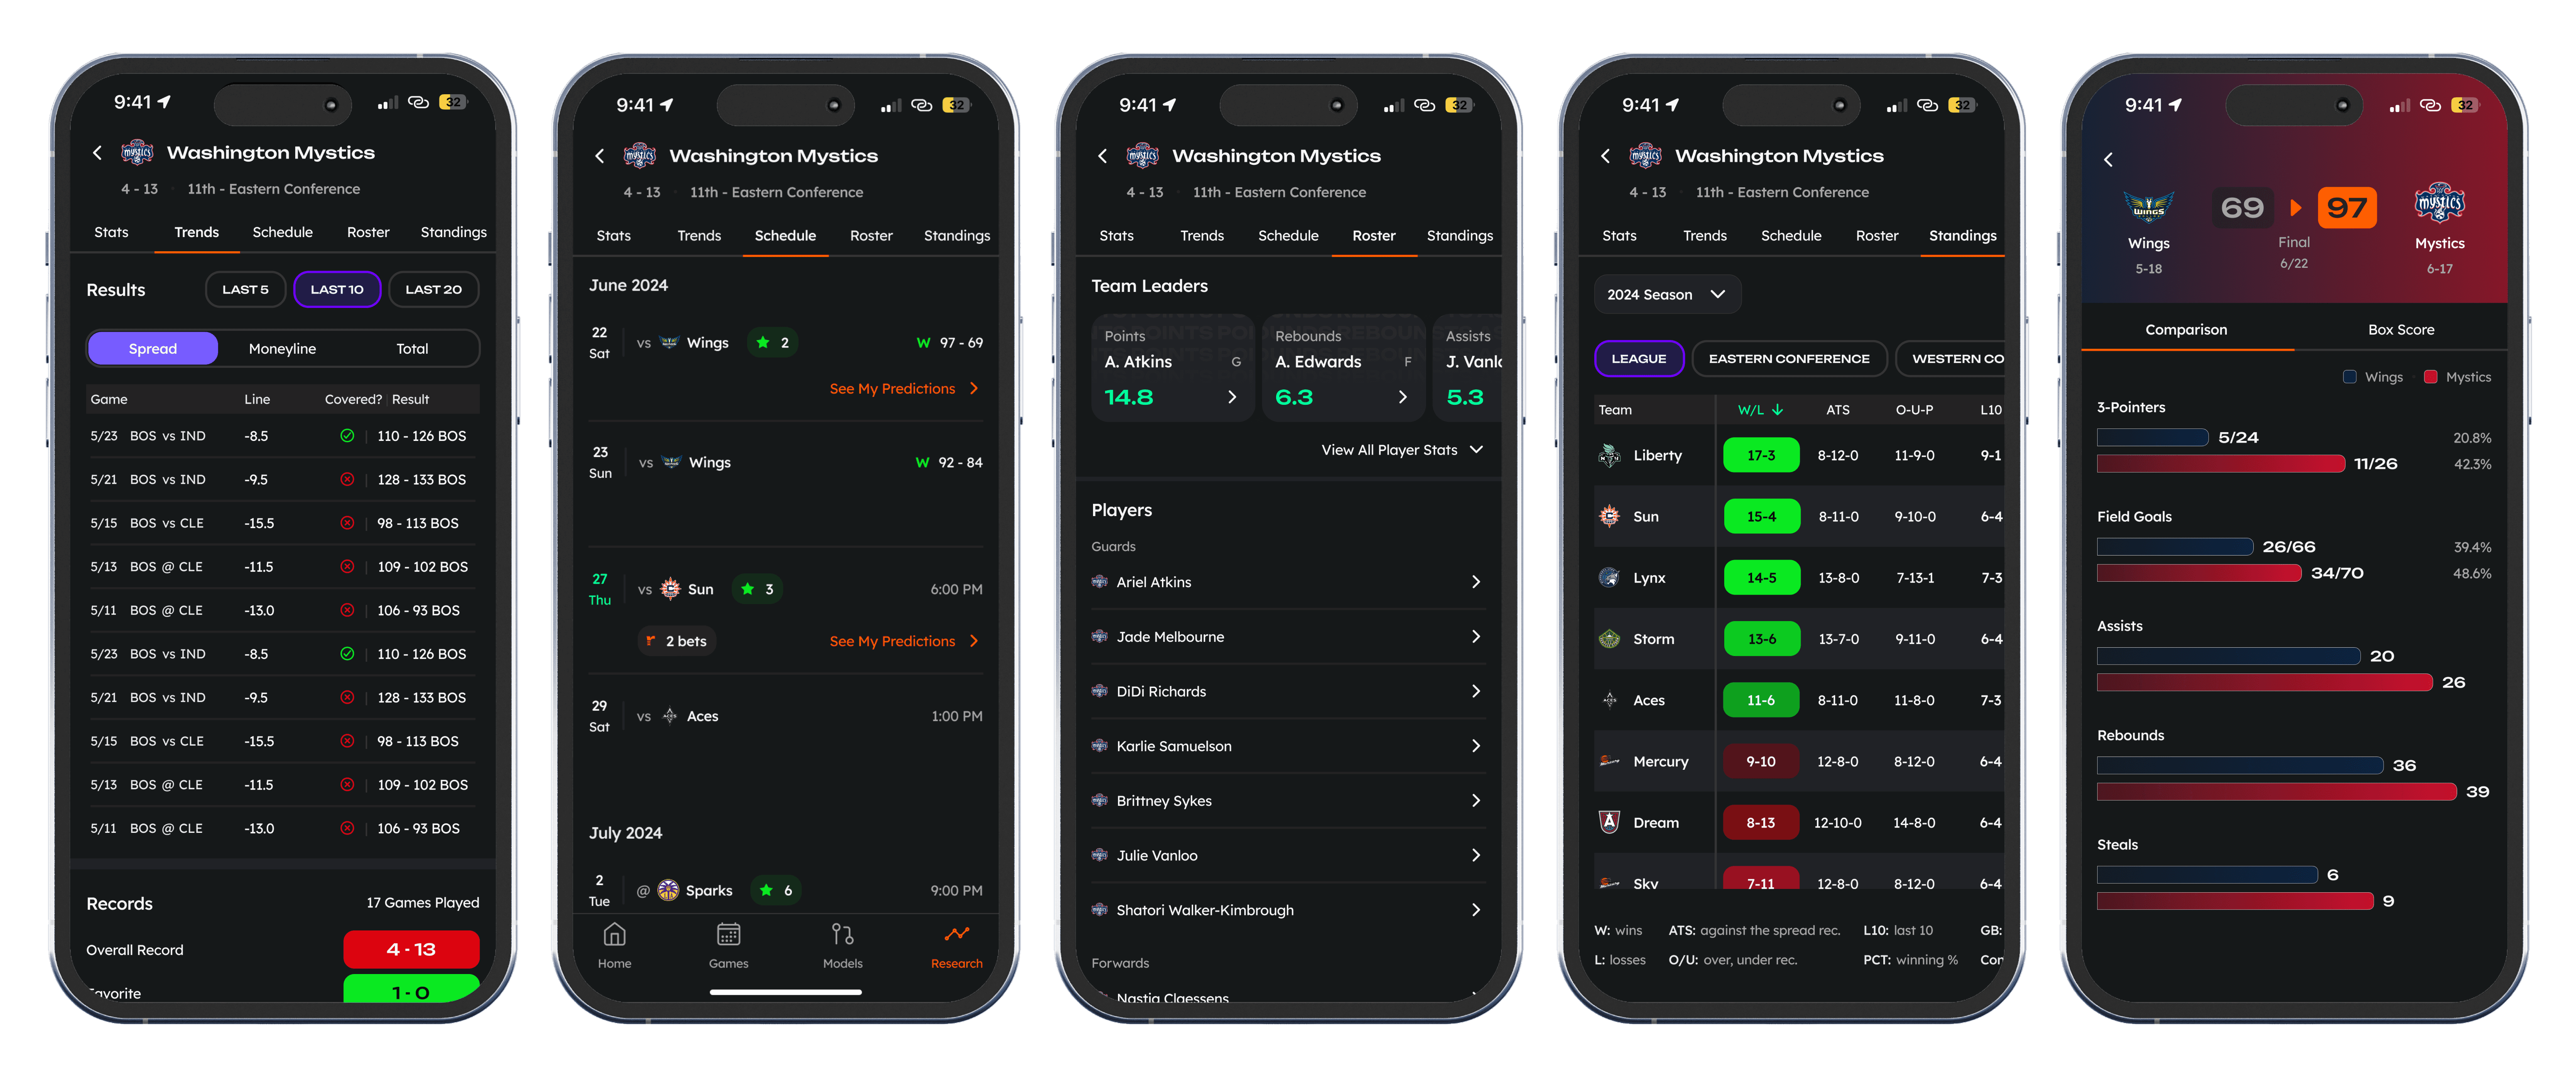
This feature became a core destination in the app, offering users proprietary team rankings, historical performance, trends, team rankings, and player stats - all easily accessible from the bottom navigation.
Serves as a flexible research hub.
Directly supports Rithmm's goal of increasing trust and engagement by making data transparency a core part of the user experience.
Scroll to Section

Introduction;
This project focuses on designing a research feature to increase trust and engagement by giving users direct access to proprietary team rankings, game results, stats, and trends.
Rithmm is a mobile app giving users the ability to personalize sports betting models.
A sports betting model utilizes predictive analytics and historical data to predict the outcome of upcoming games and player props. You input what you think is important to the outcome of a game and from there, Rithmm's algorithm builds a unique model. This model is able to tell you what bet to take based on win probability and risk to reward ratio. All of this makes for a smarter, better bettor.
Problem & Goal;
The Problem
Many users lack the context they need to fully trust Rithmm's picks.
For less experienced users like Dow Jones Dave, picks can feel like a black box without clear reasoning.
For more advanced users like Analytical Alex, the lack of historical data, trends, and performance context prevents them from using Rithmm's picks as a credible data point alongside their own models.
Without a layer of research and supporting data, Rithmm risks losing the trust of both audiences, limiting engagement and reducing the likelihood that users will consistently rely on the platform.
Hypothesis
By adding a research feature that surfaces team and player stats, performance, trends, and relevant data points alongside Rithmm's picks, we can:
Increase trust in the platform
Increase engagement
Bridge the gap between novice and expert users
Research;
To better understand how users expect to view sports stats and betting data, I looked through some key players in the space including ESPN, DraftKings, Action Network, Outlier, Pikkit, and Linemate. This helped me identify common patterns in how research data is surfaced, organized, and contextualized within betting workflows.
In addition to external research, I also held working sessions with our Data Scientists/Quants, Product Manager, and both backend and frontend engineers to get a clear understanding of what data we could surface. This included publicly available data like past game results, player stats, and win/loss records, as well as proprietary team and player rankings generated directly by Rithmm. The rankings gave us a unique advantage, offering original insights users couldn't find elsewhere. These conversations ensured that my design exploration was grounded in technical feasibility from the start.
This helped me identify three core design challenges:
1 - Balancing data density and clarity. Sports stats contain large amounts of complex data which can overwhelm users if not presented clearly.
2 - Visualizing complex data.
3 - Avoiding information overload.
Finally, I mapped out potential entry points for the research feature, considering whether it should live on the homepage (where users would encounter it naturally) or in the bottom navigation bar (as a standalone tool). This placement exercise helped inform the broader experience flow and how deeply integrated research should be into the overall user journey.
Proposed Solutions;
I worked to organize and group the data we had access to, determining which data belonged together and how it should be separated across different pages or sections within the research experience. This step was critical to ensuring the feature didn't overwhelm users with too much information at once, while still giving them access to everything they might need.
To explore layout, hierarchy, and flow I created initial wireframes, focusing on how to guide users from high-level insights down to more granular stats if they wanted to dig deeper. These wireframes helped clarify how the research feature could connect directly to the picks users were already viewing, ensuring research didn't feel like a disconnected data dump but rather a natural extension of the decision-making process.

With structure and flow established, I created low-fidelity screens that began to explore not just the content and layout, but also the visual language for representing trends, stats, and performance. This included thinking through how to display rankings, records, and game outcomes as well as the graphing style for player and team performance trends.

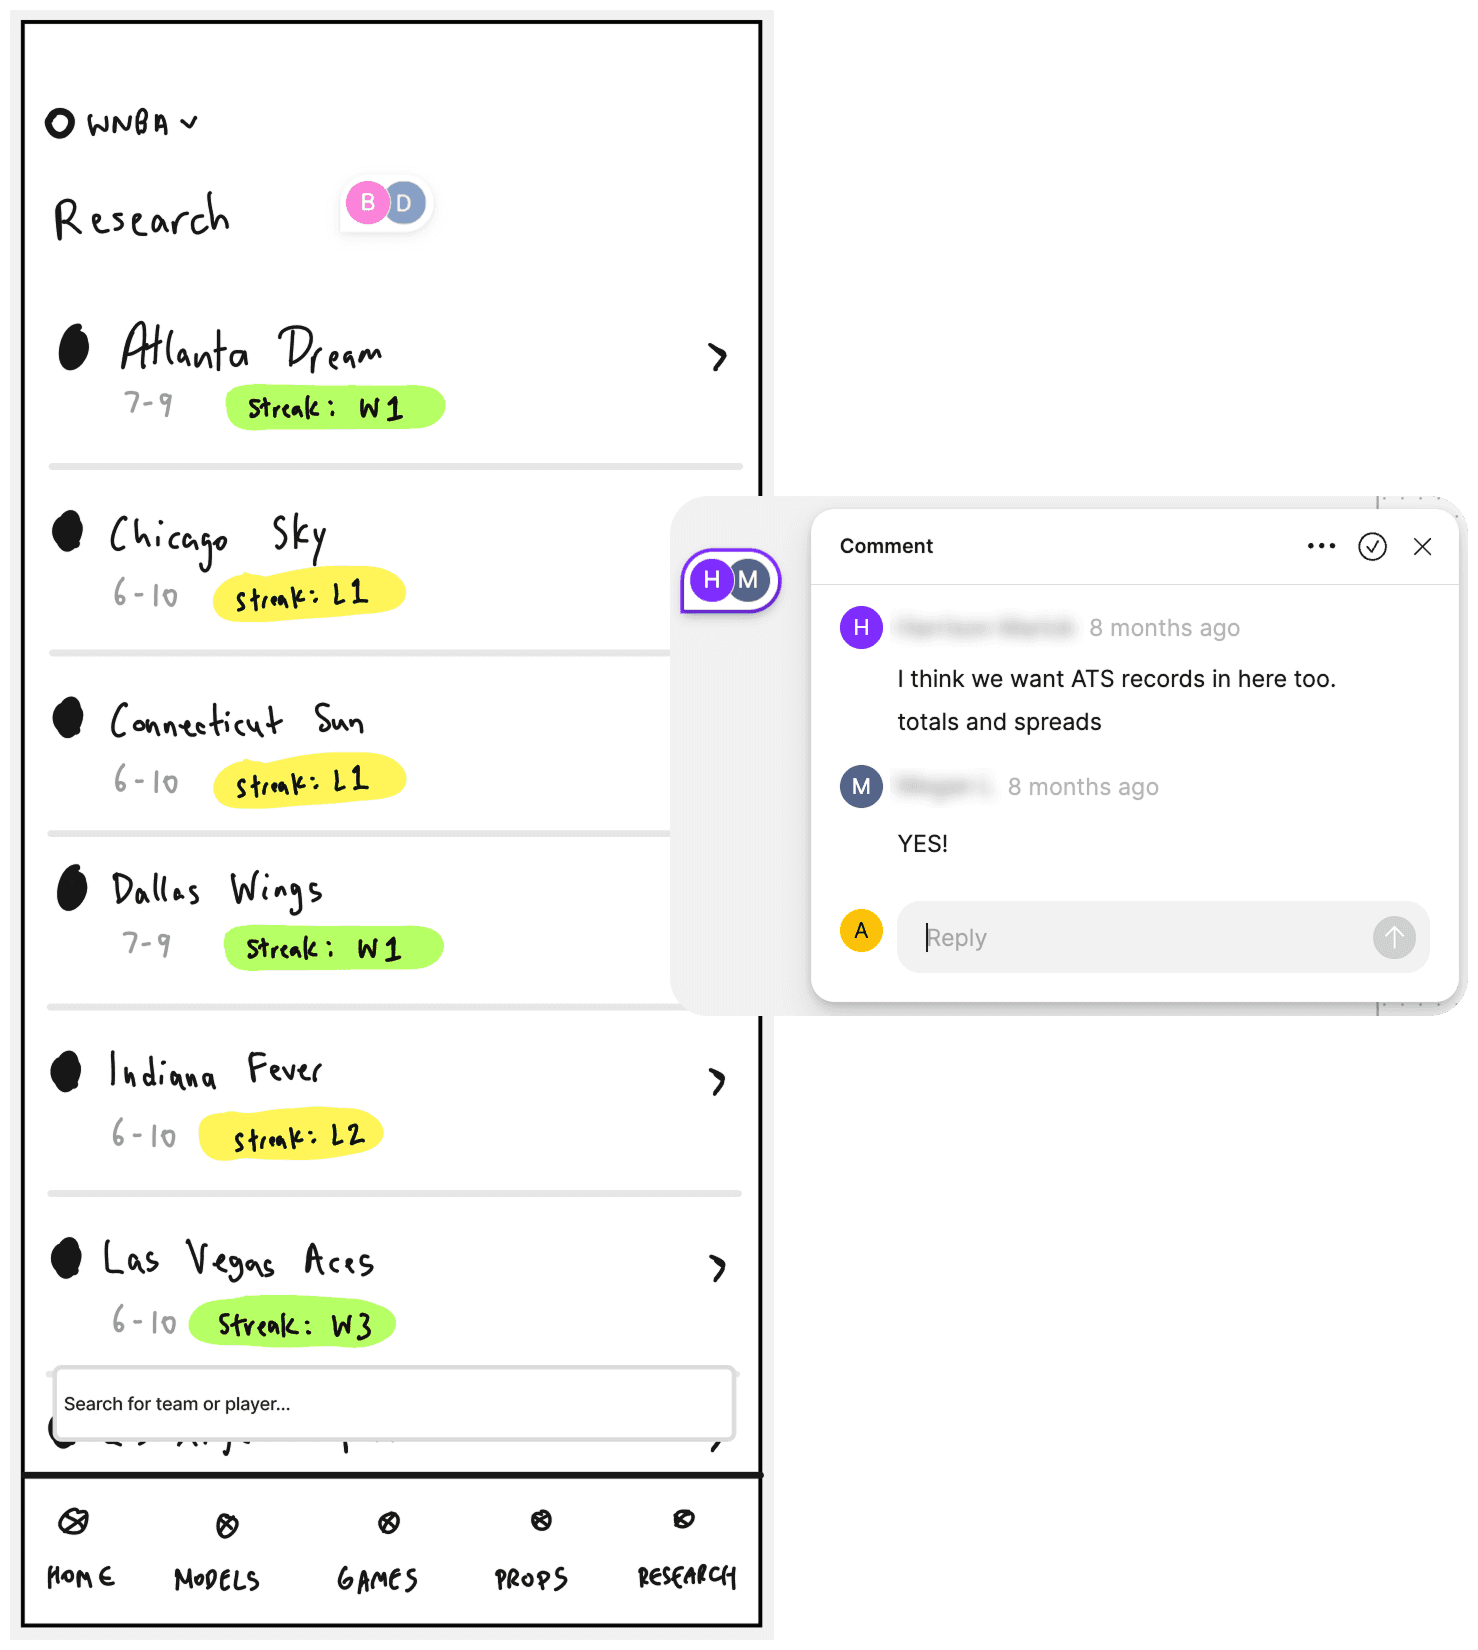
Internal Review & Revisions;
The initial lo-fi designs were reviewed by the full team to gather feedback and align the design with technical feasibility and product goals. Based on this feedback, I made a few adjustments to the information architecture and refined the visuals.
This iterative process ensured the research feature was both technically achievable and aligned with the expectations of both beginner and advanced users, striking a balance between clarity and depth.
Key Feedback
Main page will have some more information like standings, stats, and ranks. We also want to show against the spread records.
Utilize stacked bars to display stats for 2 teams instead of 2 horizontal bars meeting in the middle.
Include graphs from pre-game view in the trends section.
Ensure users are able to sort in different orders.

Final Design;
Key decisions in the final design:
Permanent placement in the bottom navigation bar: research became a primary feature accessible at any time, reducing friction and reinforcing its importance as part of the core product experience.
Logical grouping of data: information was organized into intuitive categories such as team rankings, past performance, player stats, and trends to make navigation straightforward.
Layered visuals: high level summaries were shown upfront, with options to dig deeper into granular stats for those who want more.
Proprietary Rankings: the final design also featured our own calculated team rankings, giving users unique data they couldn't find elsewhere and further reinforcing trust in our modeling process.
This design directly supports Rithmm's broader goal of increasing trust and engagement by giving users transparency into the data behind the model's picks, the research feature helps bettors feel more confident and view Rithmm as a credible data source both of which increases their overall time in app and takes away the need to go to a competitor for that information.
With this feature, research becomes a trusted companion to the picks themselves, evolving Rithmm from a "pick generator" to a more robust sports research tool — adding value for both casual and analytical users alike.
Check Out Rithmm's Player Prop Graphs